Thanks to Annette Crisp, Senior Lecturer in Health & Life Sciences for this blog post:

Hi everyone and thanks for reading this Blog post which is based on my experiences of using Visual media to plot, analyse and interpret data in a social sciences arena.
I’ve called the post ‘Surviving the Attraction of Visual Research’ because actually, the use of visual media in a piece of research, which used research tools taken from Complexity theory became as much of an attractant to my personal understanding of the research subject as did the PhD process itself.
The idea of complexity is based on the understanding that nothing is absolute- that the whole of ‘something’ –(whatever is under study- in my case community policing) can be effected by small sometimes unpredictable or invisible changes, so, rather than a ‘process’ or issue being one that would naturally progress along a linear pathway over a period of study, there is a suggestion that there will (or may) be attractants (stable or strange) that will act to influence the ‘something’ under investigation which means that it might not end up at the anticipated point- or alternatively might end up when or where expected but with additional experiences which consequently impact on the end product.
It is thus important to try to appreciate the whole picture as opposed to a snapshot.
One of the issues associated with modern community policing is that officers daily have to deal with incidents which require an appropriate response to complex or wicked problems. The responses they make to common community based crimes may consequently be based on unpredictable diverse situations in spite of being codified by law and policy. They may perceive for example that they are being sent to deal with a small community problem and find on arrival that they are at the heart (or basin of attraction) of a potential disaster.
Essentially there may not be an absolute appreciation of an incident, as it might exist in a number of different states prior to its resolution. Add to the mix; the officer’s experiences in dealing with similar events, their knowledge of the geographical location and any personal or cultural prejudices they might have about the incident (or possible individuals involved) and you have a number of psychological and physical attractants which might affect their behaviours at the crime scene and its ultimate resolution.
If you then review the behaviours and perceptions of their police managers, other front line officers and the expectations of the public all of whom come with their own set of perceptions, expectations, experiences and prejudices there may be real problems explaining the incident as a whole.
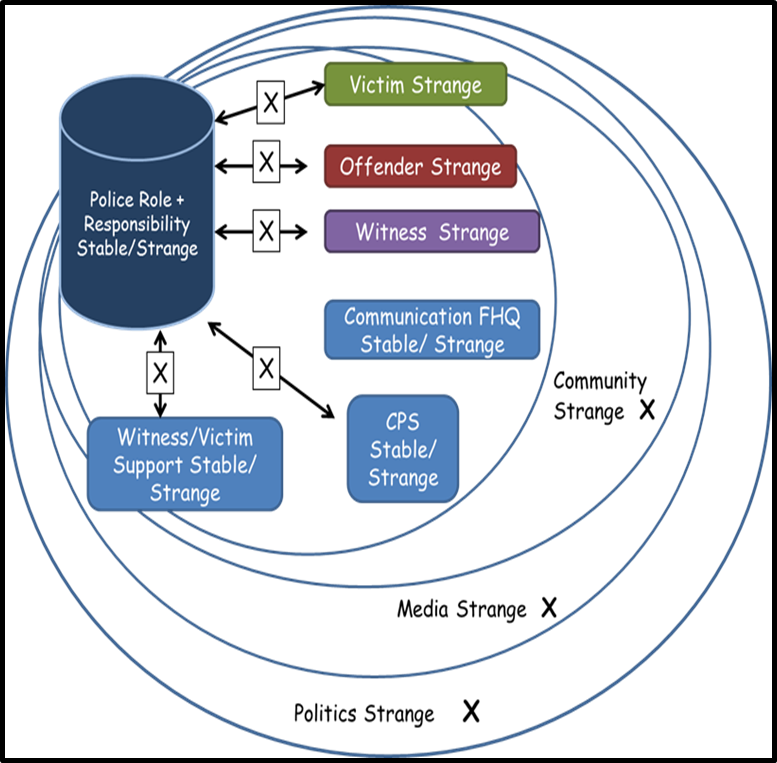
Statistical interpretations of data and the language used to interpret their impact have traditionally been used by researchers in the social sciences (even those who embrace the idea of complexity) but they usually provide a one dimensional view of a situation, generally framed by the researcher’s perspective. The adoption of visual data plotting and analysis methods however provide a 360° picture as the following images taken from my research about community policing indicate.
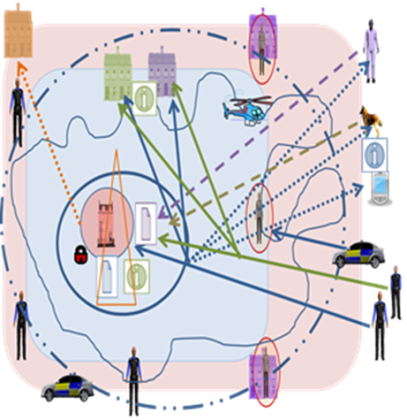
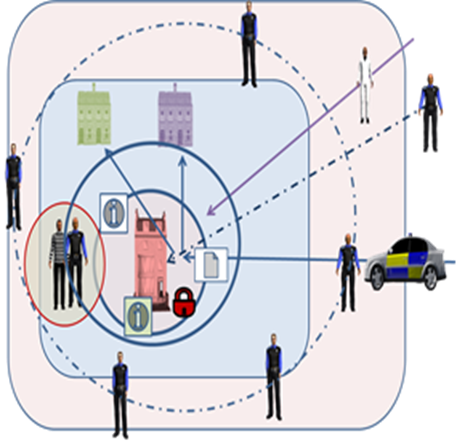
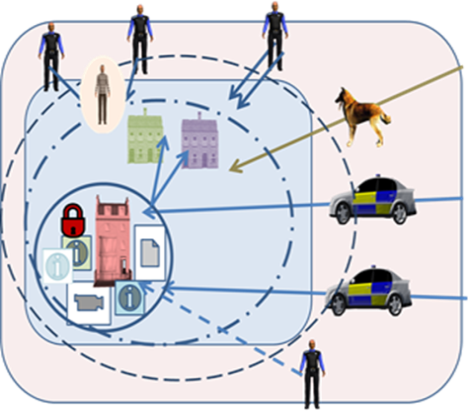
In these example maps, front line officers, their managers and the public were asked about expected police behaviours to a report of a suspected burglary.
Each map represents a series of consolidated responses based on a series of semi structured interviews.
In this first example Police sergeants explain the various processes that they (or their staff) might undertake to resolve the report of the suspected burglary –
This involves behaviours ranging from investigative processes including the use of SOCOs and police dogs to victim support immediately or post event – as indicated by the solid or dashed lines. Even without access to the Signifier Key which explains the meaning of images in the mapping in more detail, the difference between the expectations of this and other research groups is obvious.

All of these variations make the initial report and response to the offence exist in different forms. This appears to be representative of; ‘an accumulation of frozen accidents’ as noted by Gell-Mann (1995).

Importantly there was recognition by all subjects that the attractant, that is the victim/victimised property, could exist simultaneously holding different characteristics within the same incident. This was dependent on reality but also on the perceptions of those involved; akin to the Schrödinger’s cat dilemma. This type of multivariate attractant or configuration could subsequently affect the initial response however the nature of the incident and the perception of the call handler to the initial contact could elicit a number of potential responses. The consequence might be that any misunderstandings caused by the transmission or receipt of the message might elicit or catalyse unexpected behaviours at the core or target of the crime. This may alter the nature of the core attractant in some circumstances, changing the incident and its resolution, from a simple to a wicked problem. This might ultimately change the character of the record, report and response to the offence.
Whilst this is just a snapshot of my PhD work and indeed there are many other examples and explanations of behaviours within the completed thesis (based upon a number of different scenarios) you can see how visual data maps can make research accessible to many more students and particularly academics who formerly might have seen it as not having the same academic weight as those more traditional methods focusing purely on mathematical data to explain research.
Surviving my PhD was certainly a lot to do with my own appreciation of the subject and the opportunity to use the visual to make sense of complex issues certainly helped.
Thanks for reading.
If you are interested in knowing more about this research or using visual methods in the way I did please email me at acrisp@dmu.ac.uk
Annette Crisp